Figure 29 above. Pilbara Seismic tomography, 300 km depth. Geology and mineralisation, Exploration targeting based on maximum P/T gradient.
This figure has had the high P/T boundaries marked out in orange envelopes in a similar fashion to that of the Yilgarn Craton. We will discuss this figure later.

The Pilbara craton one of the world’s biggest producers of iron and has large deposits of gold, uranium and manganese and notable deposits of copper, nickel, lead zinc and tin. It is one of the worlds largest gas and oil provinces. It is Archaean and Proterozoic in age.
Pilbara structural geology and exploration targeting for iron using seismic tomography at 75 km depth.

95% of the iron found in the Pilbara is in the Coondewanna ring structure outlined in yellow. If I was looking for iron it would be within that area, preferably away from the iron mines that have already been found.
There has been a lot of research done on the iron mineralisation and recent research suggests that they are hydrothermally produced, or enriched. Thus exploration targets would be crosscutting linears and rings, fold limbs and breaks in folds as well as the right stratigraphy.
I suspect the iron came up from the outer Core?
The seismic tomography section at the bottom of the plan is about 300 km deep and 1,000 km in length. It was one of my early attempts (2017) with EagleEye at optimising seismic tomography sections for structural evaluation.
There is a down-arc where the Coondewanna ring structure is located. The combination of the down-arc and the ring in plan gives a bowl structure – impact”? The strong subvertical structures are stronger under the centre which is a continuation of the Norseman Wiluna structure which we saw on the Northern Yilgarn section in figure 20. This combination makes a Phi structure – good for fluid flow and mineralisation.
It is interesting that there are many Proterozoic sedimentary basins but few have the iron endowment of the Hamersley Basin.
An alternative hypothesis is that the iron came in with, and dispersed on the impact of an iron rich Coondewanna bolide. This would have occurred probably around the 2.6 billion years ago and the iron rich material has been incorporated into the Hamersley Group sediments. Later hydrothermal solutions may have enriched certain areas. If this is the case then there should be iron deposits in other higher tectonic areas within the Hamersley Group sediments.
Pilbara structural geology using seismic tomography at 300 km depth.

Those who don’t believe in Giant Ring Structures stop reading now!!
This is Pilbara Craton seismic tomography at 300 km depth. A 600 km diameter ring structure is visible which I called ring X. It is probably one of the originating structures for the Pilbara Craton.
My research has found one or more of these Giant Ring Structures in each of Earth’s cratons. The coastline often follows the rim of the ring structure suggesting that the lavas, which would have erupted into the centre (like the moon mares), would have provided a thick, brittle foundation for the craton to form around, and upon.
There are also N, NW, NE, and weaker EW linear structures. If linear structures cutting a ring structure (phi structure) is a criterion for mineralisation the Pilbara should be well endowed.
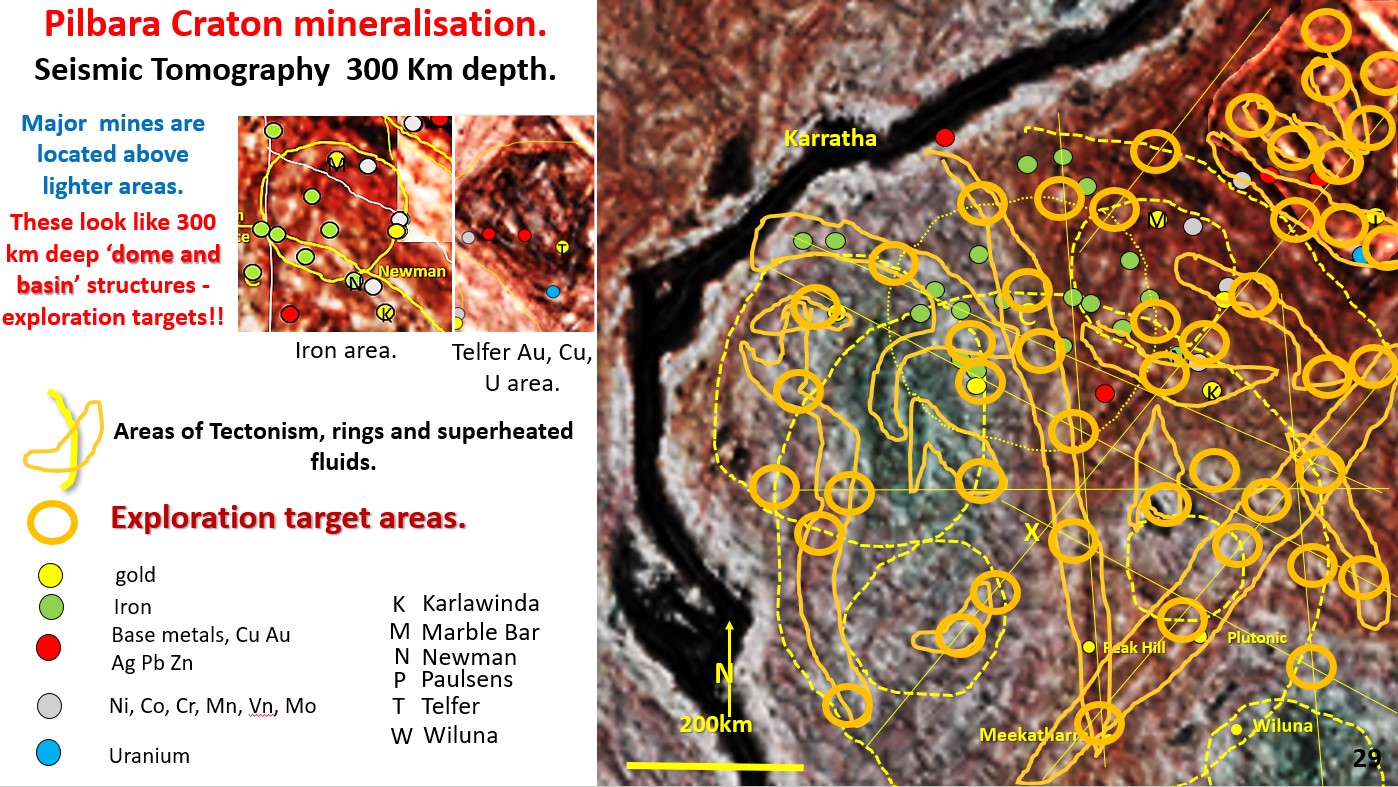
Pilbara exploration targeting using seismic tomography at 300 km depth.

This figure has had the high P/T boundaries marked out in orange envelopes in a similar fashion to that of the Yilgarn Craton (figure 22).
The rationale, as in the previous figure is that these high P/T heat flow areas appear to be the areas where the current mines are located.
There are also many small, white high P/T change spots on this plan where there are no mines which would make excellent targeting. Once again, I would be targeting these areas, particularly where they crosscut the rings and the linears. These exploration targets are the orange circles. Get in fast before they all go!
Of interest also is the Telfer area in the top right and middle left inset. It is a dome and basin structure. There are some great targets up there. I have done work on the Carlin area (figure 52) which looks like the Telfer area down at the same 300 km depth suggesting a similar deep vertical genesis for the mineralising fluids.
The main central iron mineralisation area in the top left inset also appears to have the same dome and basin structure. This has got to be useful for fine tuning targeting of iron mineralisation. Go for the white high heat flow areas!

This shows the exploration targeting envelopes based on the highest P/T changes seen at 300 km depth seismic tomography. It shows where they relate to the current land surface for targeting.