Pilbara exploration targeting using South Africa’s Witwatersrand as a template. (Part 11).
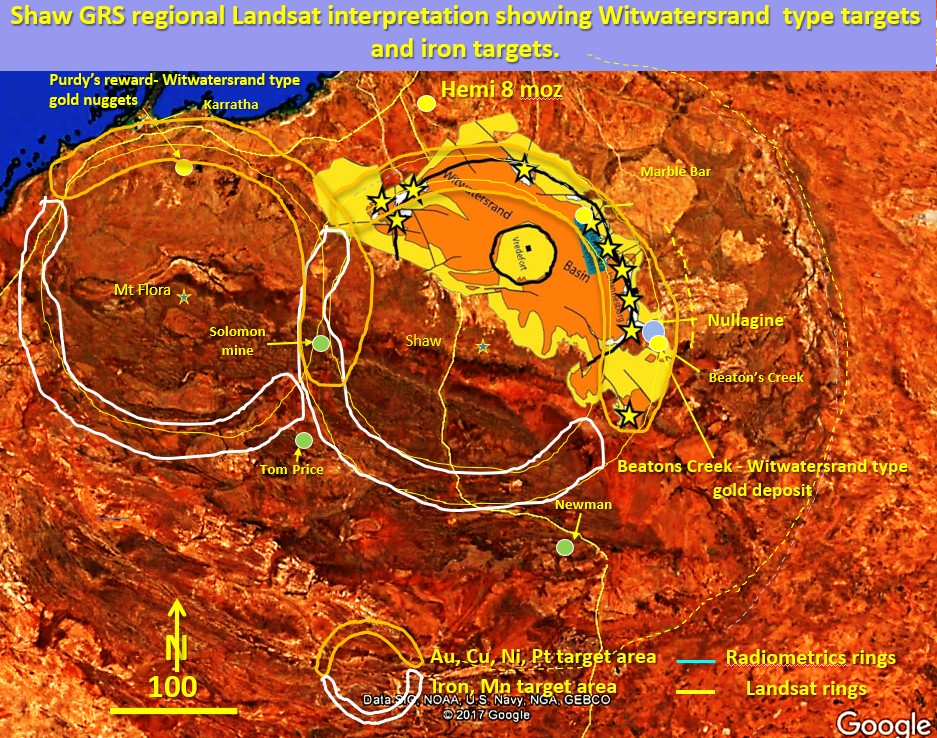
Figure 32 above. Shaw and Mt Flora ring structures, Witwatersrand type targets. There has been a lot of alluvial gold found on the unconformable Fortescue basin boundary recently. Why and … [Read More]