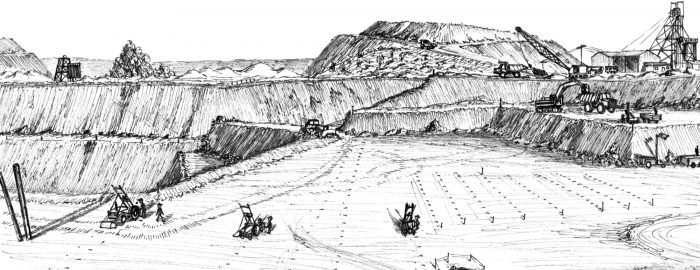
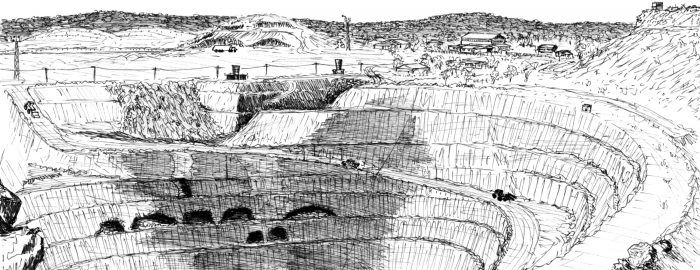
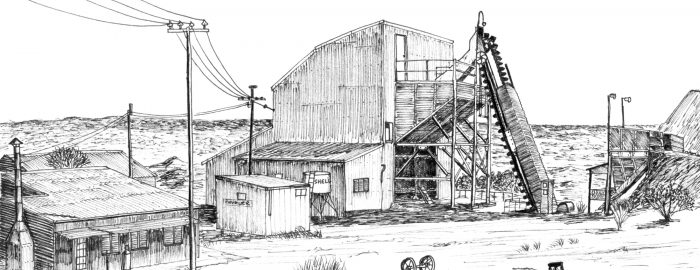
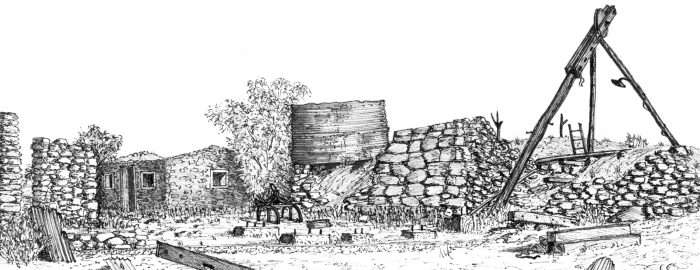
• EveningStar open pit Mount Magnet October. Bob Watchorn sketch 1987.
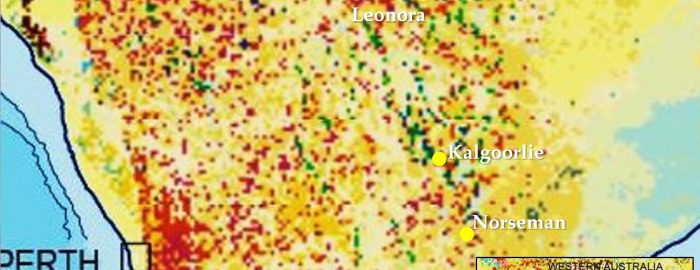
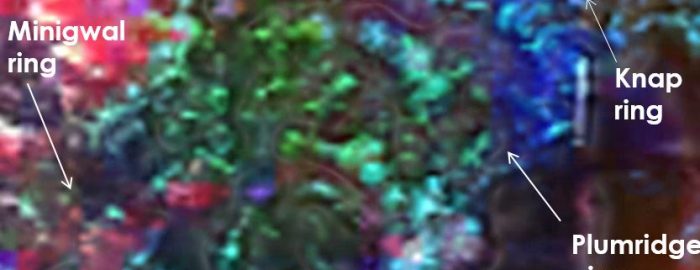
  • Leonora giant ring structure on Landsat.
  • Yilgarn surficial geology showing Cauden giant ring structure. Blewett 2004
    Yilgarn surficial geology showing Cauden giant ring structure. Blewett 2004
  • Yamarna giant ring cluster
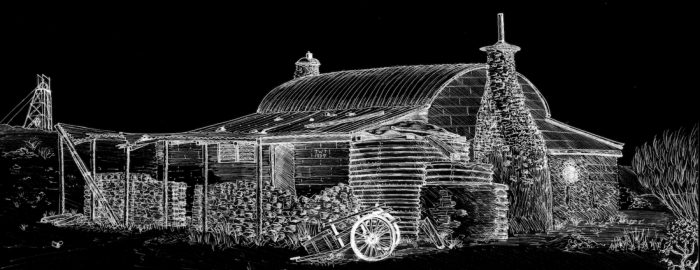
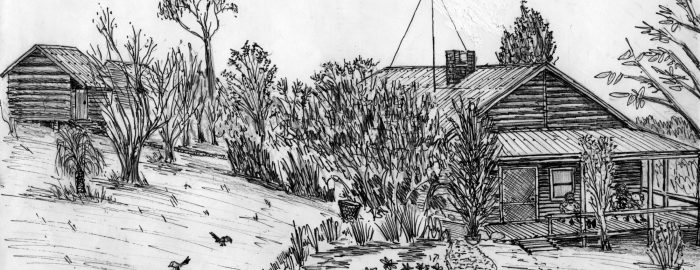
  • Jack Towers cottage Mt Magnet bob Watchorn Sketch October 1987
  • Hannans Brown Hill shaft Kalgoorlie, 1894 Bob Watchorn sketch 1996
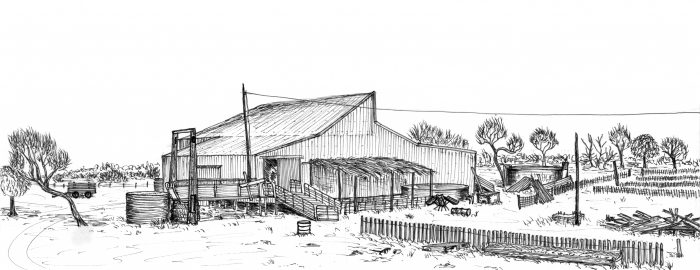
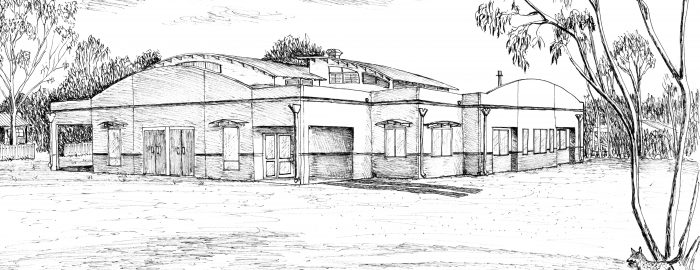
  • Wogarno shearing shed, Kirkalocka. WASO recital 1991. Bob Watchorn Sketch, 1991
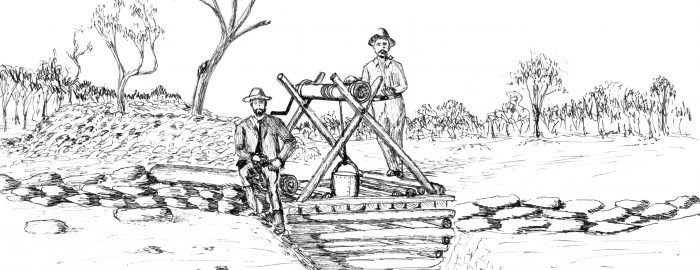
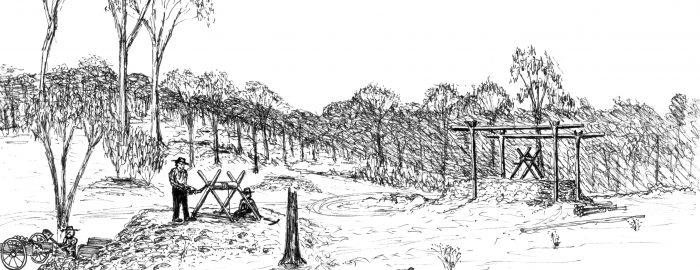
  • Great Boulder Early Shafts 1893. Bob Watchorn Sketch 1997
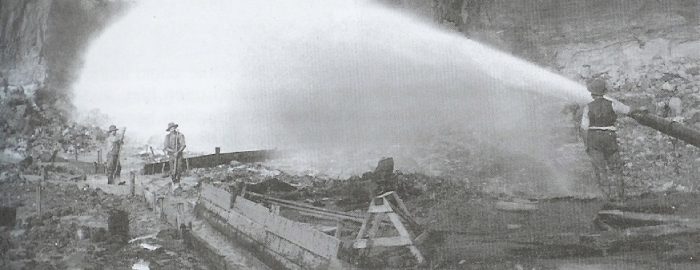
  • Mt Bischoff water cannon 1895. largest tin mine in world at that time. Kick started Tasmania's economy.
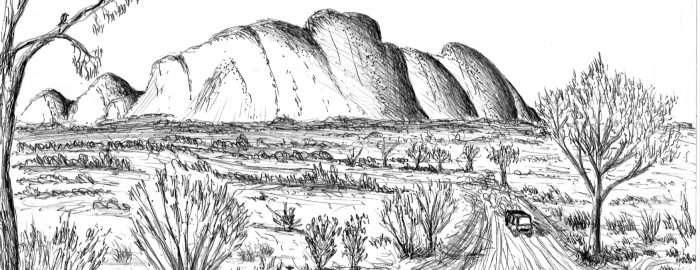
  • The Olgas Kata Tjudata, from the west 1996. Bob Watchorn Sketch 1996.
  • Kalgoorlie Baptist Church, Bob Watchorn Sketch 1998
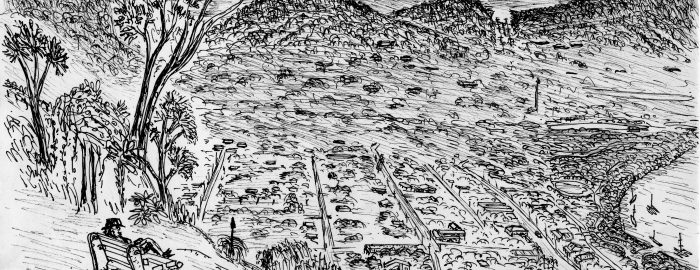
  • Cooktown Queensland from Grassy Hill to the south. Bob Watchorn sketch 2006
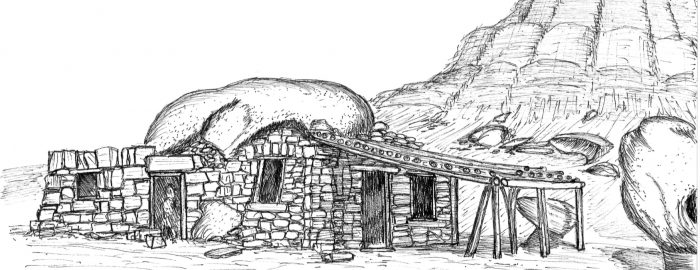
  • Cliff Dweller houses, Arizona USA Bob Watchorn sketch 2006
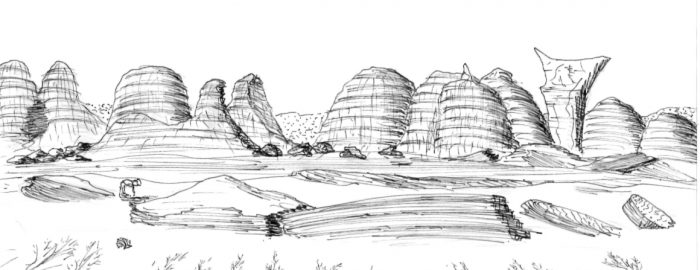
  • Barnhill Station Bungles Kimberly Western Australia. Bob Watchorn Sketch 2009
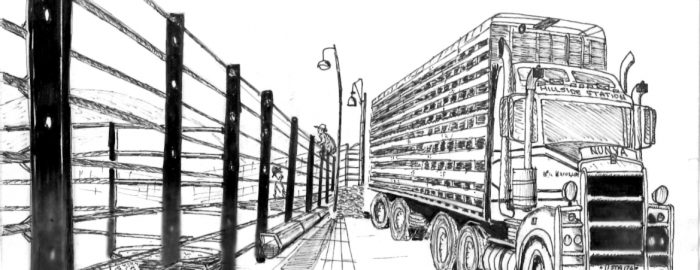
  • Cattle truck Hillside Station Pilbara Western Australia. Bob Watchorn Sketch 2009
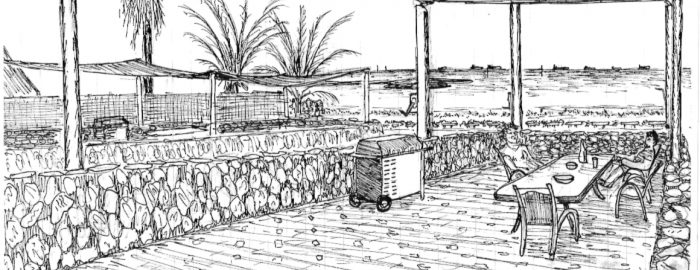
  • Balcony overlooking Port Hedland bay Pilbara. Bob Watchorn Sketch 2009
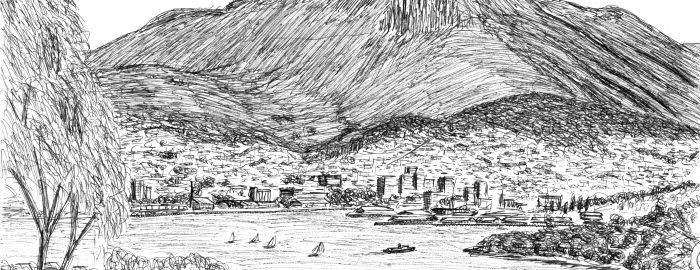
  • Hobart from Lance and Shirley Watchorn's balcony. Bob Watchorn sketch 1999.
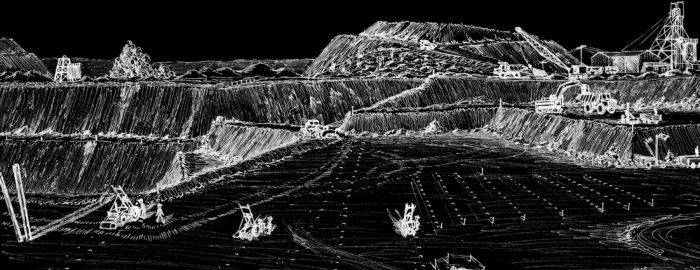
  • Evening Star open pit Mt Magnet. Bob Watchorn Sketch 1987
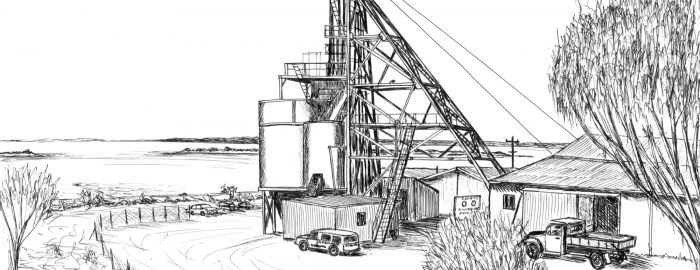
  • Silver Lake Shaft WMC Kambalda. First big Nickel mine in Australia Bob Watchorn Sketch 1996
  • Silver Lake Shaft WMC Kambalda. First big Nickel mine in Australia Bob Watchorn Sketch 1996
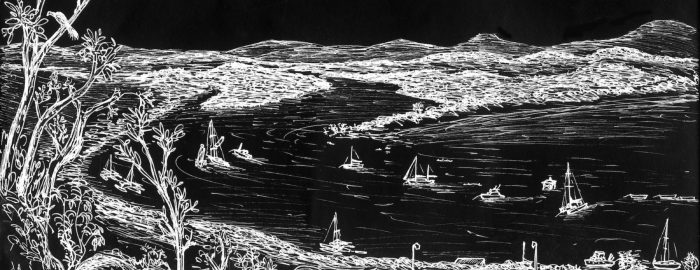
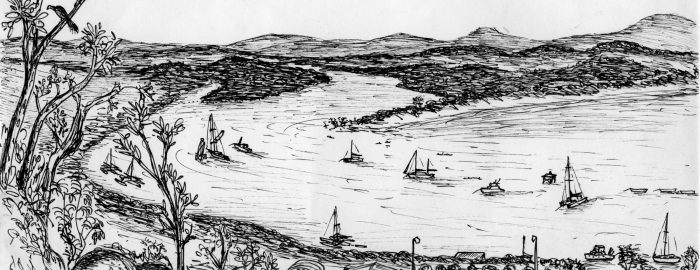
  • Cooktown from Grassy Hill on the Endeavor river, Queensland. Bob Watchorn Sketch 2006
  • Cooktown from Grassy Hill on the Endeavor river, Queensland. Bob Watchorn Sketch 2006
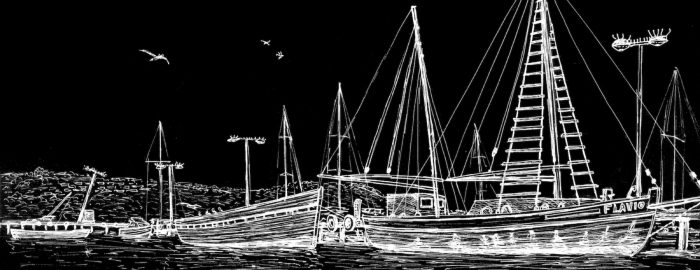
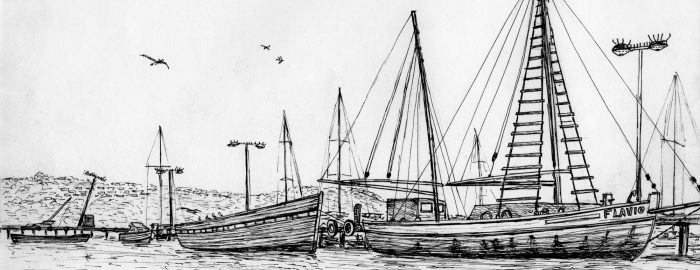
  • Fishing boat harbour. Albany 2006
  • Fishing boat harbour. Albany 2006
  • Shalom retreat, Manjimup Western Australia 2003
  • Victory-defiance open pit Kambalda. Bob Watchorn Sketch 1994
  • Hill 50 main shaft, Mt Magnet western Australia. Bob Watchorn Sketch 1987
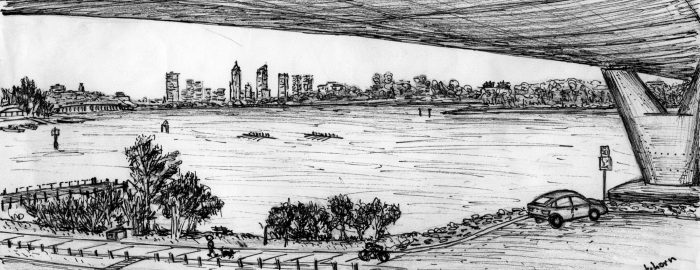
  • Perth, Western Australia from beneath Mt Henry Bridge, Mt Pleasant. Bob Watchorn Sketch 1999
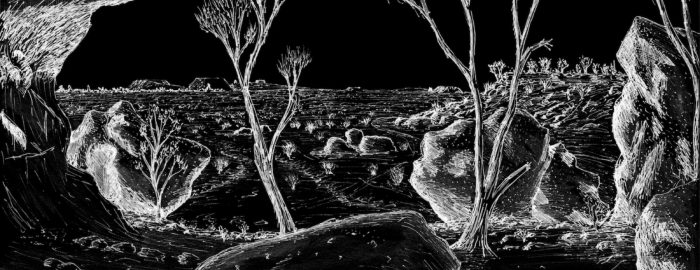
  • The granites, Mt Magnet, Western Australia. Bob Watchorn Sketch 1987.
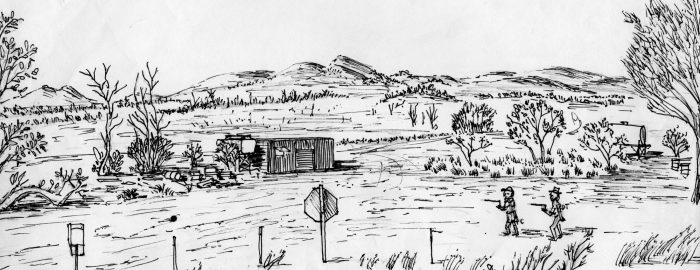
  • Two intrepid divining-rod prospectors, Peter Cook and Donald Thompson, Wingellina nickel project, Western Australia 2006
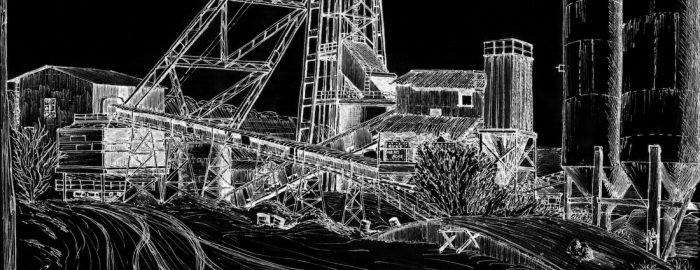
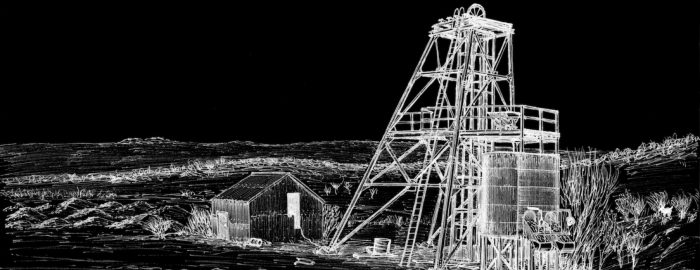
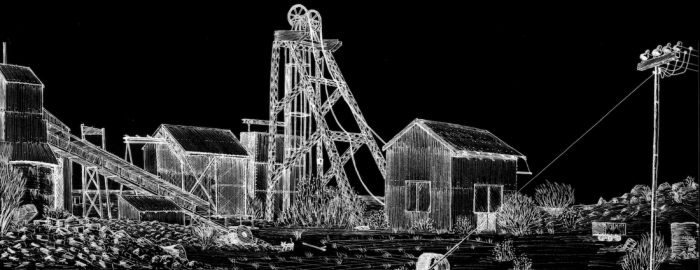
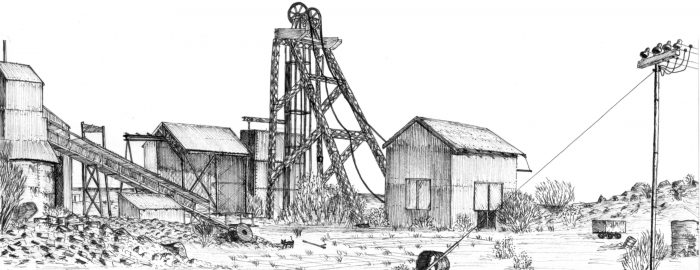
  • Brown Hill Shaft. Mt Magnet, Western Australia. Bob Watchorn sketch 1988.
  • Brown Hill Shaft. Mt Magnet, Western Australia. Bob Watchorn sketch 1988.
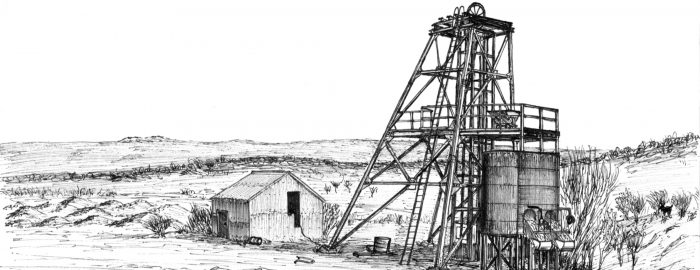
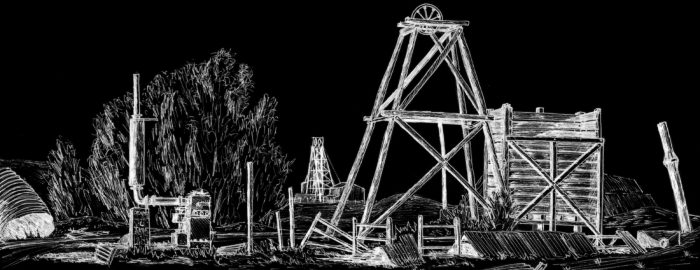
  • Eclipse mine shaft Mt Magnet. Bob Watchorn sketch 1987.
  • Eclipse mine shaft Mt Magnet. Bob Watchorn sketch 1987.
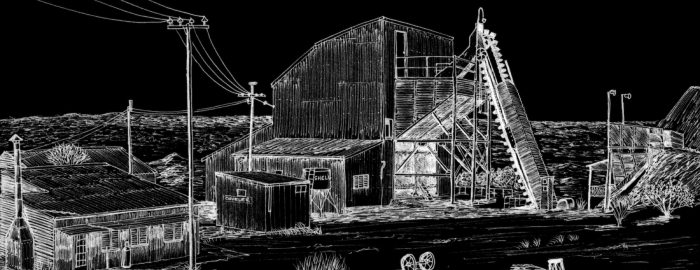
  • Boogardie State Battery, Mt Magnet, Western Australia. Bob Watchorn Sketch 1988
  • Boogardie State Battery, Mt Magnet, Western Australia. Bob Watchorn Sketch 1988
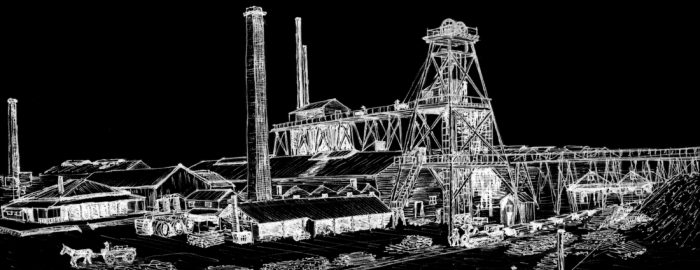
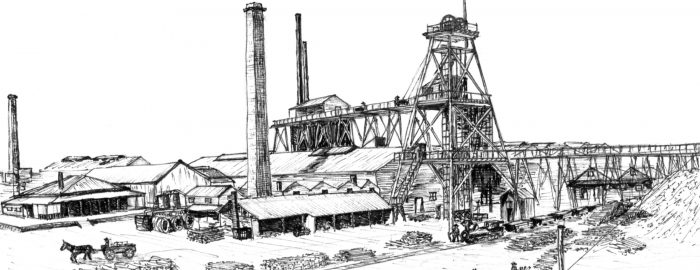
  • Great Boulder main shaft Kalgoorlie, Western Australia 1903. Bob Watchorn Sketch 1997.
  • Great Boulder main shaft Kalgoorlie, Western Australia 1903. Bob Watchorn Sketch 1997.
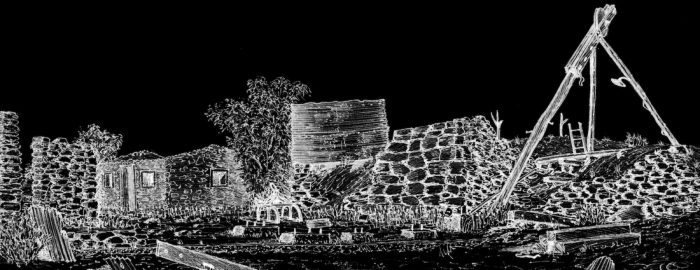
  • Hesperus Dawn Gold Mine Ruins, Mt Magnet, western Australia. Bob Watchorn sketch 1997.
  • Hesperus Dawn Gold Mine Ruins, Mt Magnet, western Australia. Bob Watchorn sketch 1997.
  • Edward Carson shaft, Mt Magnet, Western Australia. Bob Watchorn sketch 1988.
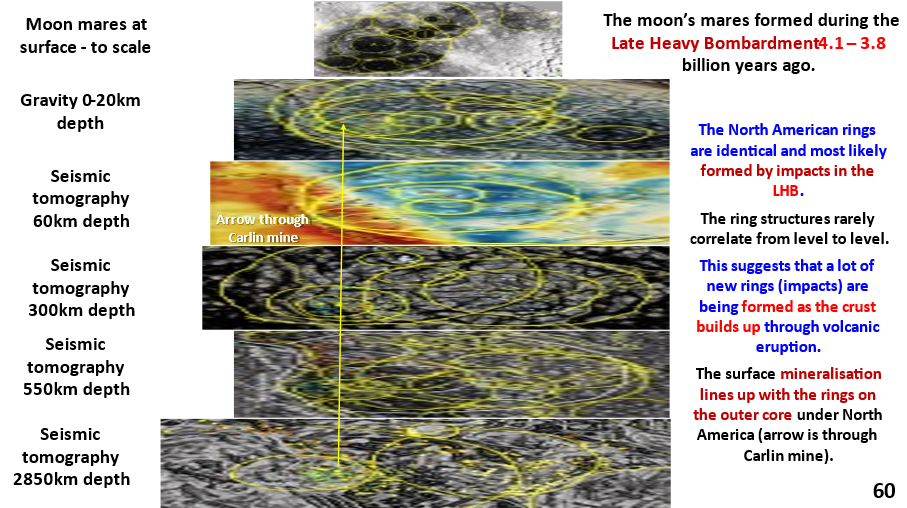
Figure 60. Stacked sections of North America from outer core to surface with inset of moon for comparison.

North America stacked sections – gravity, seismic tomography 60 to 2850 km depth and Lunar surface. Part 14. Verification of my ‘EagleEye’ structures showing examples.

Figure 60. Stacked sections of North America from outer core to surface with inset of Lunar Mares for comparison. Read the annotations on the above figure before you start the … [Read More]

Like it? Share it!
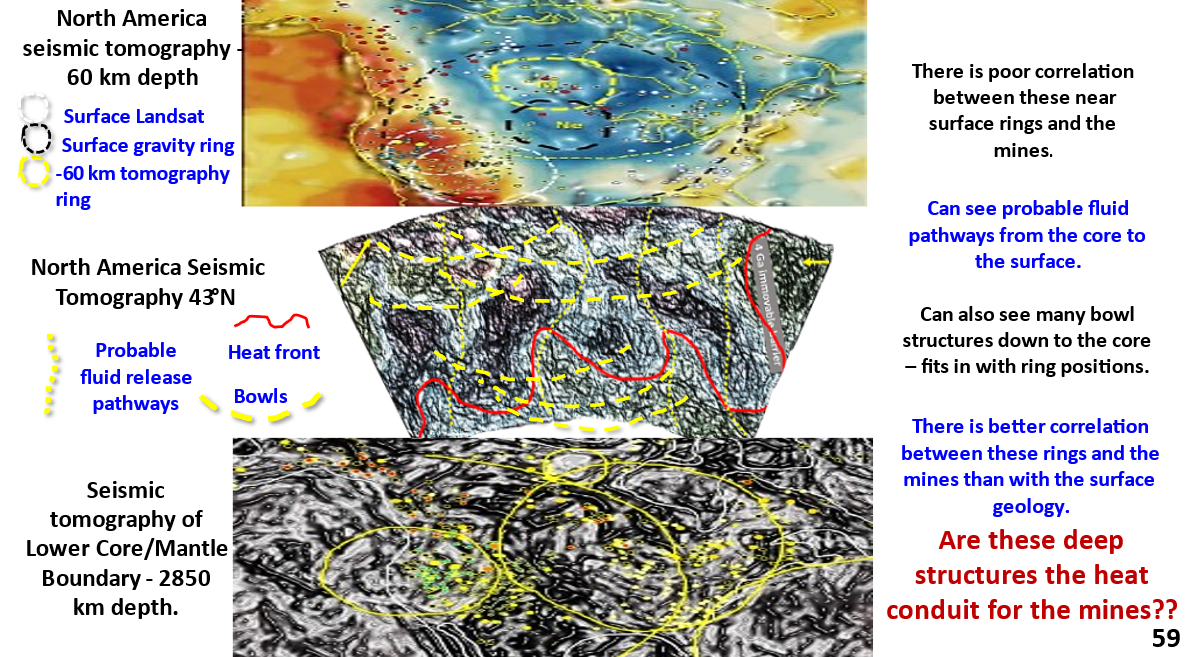
Figure 59. North America interpreted, enhanced seismic tomographic plans at 60 km depth and outer core plan at 2850 km depth with cross-section 36°N.

North America Seismic Tomography plans at 60 km and 2,850 km depths with joining seismic tomography cross-section. AusIMM webinar Part 13.

Figure 59 (above). North America interpreted, enhanced seismic tomographic plans at 60 km depth and outer core at 2850 km depth with cross-section 36°N. This figure summarises my concept of … [Read More]

Like it? Share it!
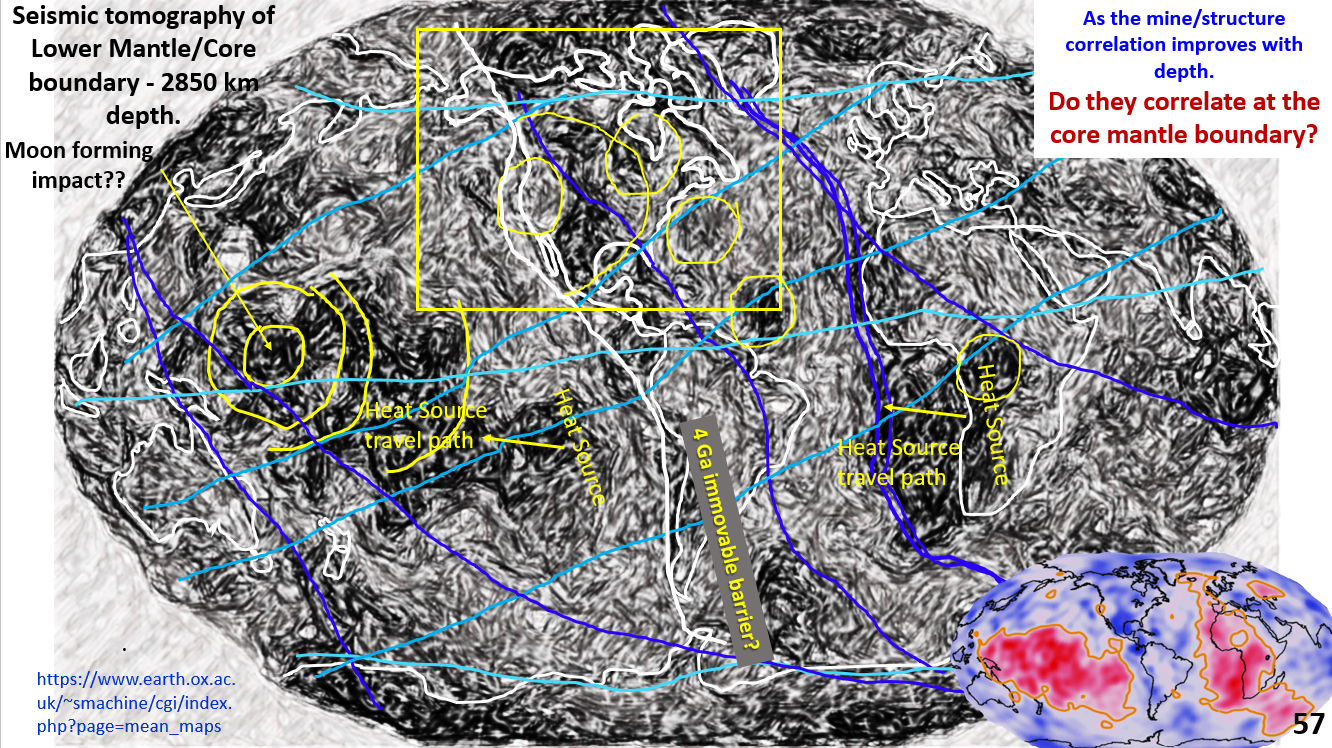
Figure 57. Outer Core/Lithosphere Boundary interpreted, enhanced seismic tomographic plan.

Earth Seismic tomography at 2,850 km depth at the outer core/mantle boundary. AusIMM Webinar Part12.

Tracing the surface structures right down to the Core Mantle Boundary (CMB) is a new area of my research (you see it first here!), . This is the first time that ultra-detailed structural geology of deep Earth has been used in constructing a model of Earth’s evolution down to the Core Mantle Boundary.
RESULT? The seismic tomography of the Core Mantle Boundary shows linear and ring structures that relate to those on the surface and on the 200 km depth tomography. How can structures 2,850 km deep propagate to the surface??
The fact that the same structural features are in the same geographic relationship to the continents above suggests that overall there has been little movement of the surface of Earth with respect to the CMB. How can this occur??
By what mechanism can the earth above the CMB be immovable when the plates at the surface move?
POSSIBLE MECHANISM. Erosion removes the pop-up mountains and the reverse spinning 5,000 C semi-liquid outer core would slice off the pop-down material like a laser cutter! This relieves the plate movement pressure and enables the continents to remain relatively static and still enable the observed plate movement.
if the mines do lie on the structures on the Core Mantle Boundary this will support this hypothesis of the hot mineralising fluids originating at the CMB.
MINERALISATION. The mechanism for deep-seated mineralisation would be super heated fluids from the core scavenging metals either from the core as they ascend and depositing them further up. It makes a lot of sense to me!

Like it? Share it!